Lidar, which stands for Light Detection and Ranging, is a method of remote sensing that uses lasers to measure the distance between two objects. Precise, three-dimensional models of the Earth's surface can be generated from these measurements.
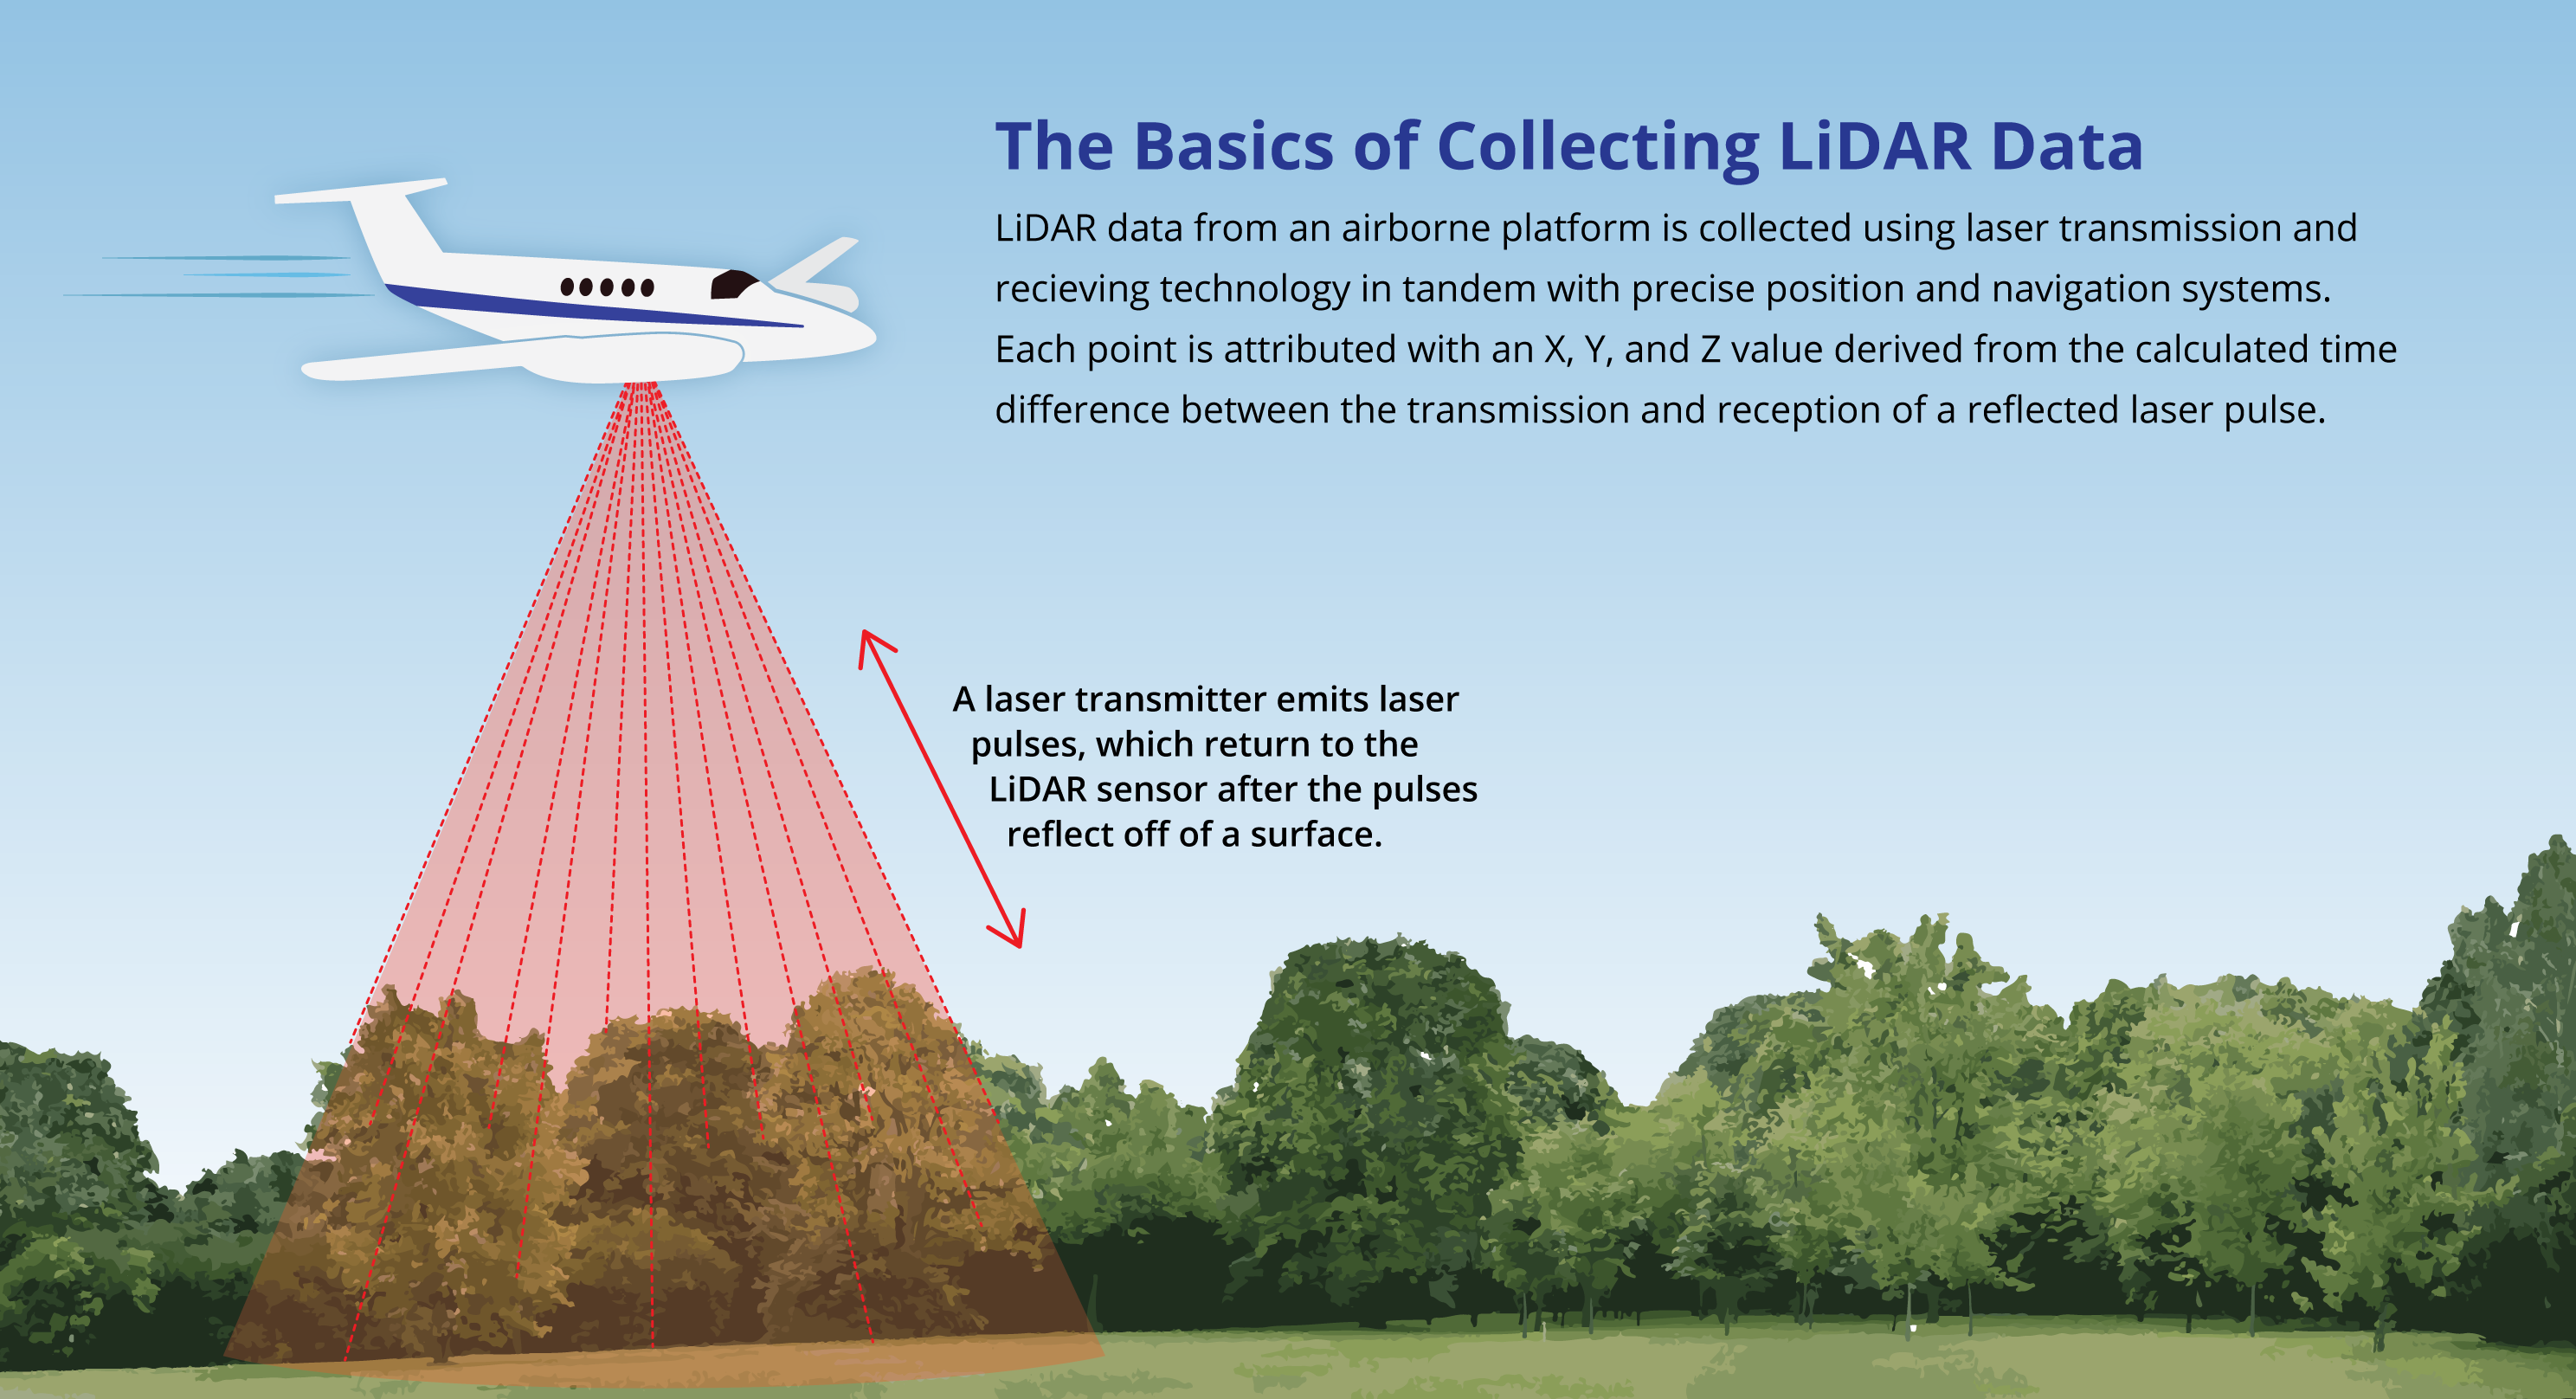
How is Lidar data collected?Airborne lidar is collected using a pulsed laser that originates from an airplane or helicopter. A sensor on the aircraft measures the time it takes for the laser to return after reflecting off a target, in this case, the surface of the earth. The laser travels at a known speed. By measuring the time it takes for the laser to return to the aircraft, the precise distance between the aircraft and the ground surface can be calculated. The lidar sensor also includes a GPS receiver to detect the location and orientation of the aircraft when the laser pulses and the sensor receives data.
https://blog.bluemarblegeo.com/2017/04/27/got-lidar-now-what/
The collected lidar data are converted into millions of discrete points, called a point cloud. The elevation of the return will vary, depending upon the shape and size of the objects the lidar laser pulse is reflected from on the ground surface. Using specialized computer software, these points can be classified into various types of returns: tall trees, brush, grass, asphalt surfaces, buildings, etc. Geoscientists are generally only concerned with how the ground surface appears, without vegetation. Thus, only ground surface, or bare-earth returns, are used and vegetation and building returns are excluded. This bare-earth point cloud is then used to generate a digital elevation model (DEM) of the earth's surface.
How do geoscientists use lidar?Lidar helps geologists see the surface of the Earth with greater precision and accuracy than was previously possible. Many geologic landforms visable on lidar derived DEMs cannot be seen using traditional aerial photography, like that found on Google Earth, or even by walking on the ground!
Lidar DEMs can be used to show the surface elevation, but geoscientists make derivative maps to help visualize the landscape. Two of the most common maps are hillshade (or shaded-relief) and slope maps. Hillshade maps portray the landscape in 3-D. Slope maps show variations in the steepness of the topography. When symbolized from dark-to-light, dark colors represent steep areas and the light colors represent gently sloping to flat areas. Those slope maps or “slope shades,” can show the terrain in high-detail.
Older DEMs were generated by the U.S. Geological Survey (USGS) with a pixel resolution of either 30-meters or 10-meters. This resolution is coarse and does not show the detail of geologic landforms very well. DEMs derived frm the newly acquired lidar for Virginia are available as rasters with 1-meter resolution, a significant improvement. Below is an example of the older, low-resolution, 10-meter USGS DEM data for McAfee Knob, a well-known overlook on the Appalachian Trail in Roanoke County. Compare this to the high-resolution, 1-meter lidar data that is now available.
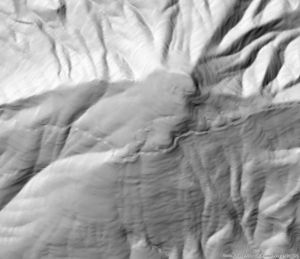
10-meter Digital Elevation Model
from older USGS dataset
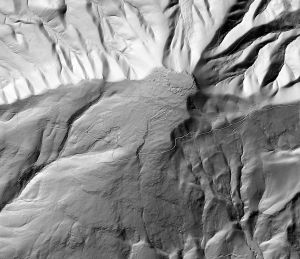
1-meter lidar derived hillshade raster
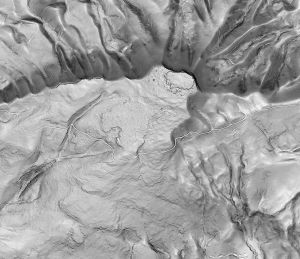
1-meter lidar derived slopeshade raster
Download a sample of lidar data for McAfee Knob here! You will need Google Earth loaded on your computer to view the data.
here Where are lidar data available in Virginia?
There is now complete lidar data coverage for the entire Commonwealth. Approximately 30 different lidar datasets, collected from 2010 to 2020, are available for download through the U.S. Geological Survey and the Virginia Geographic Information Network (VGIN). Please keep in mind that lidar data sets contain millions to billions of points and can be several gigabytes in size. Lidar data are often found in LAS or LAZ file format, an industry-standard binary format used for storing 3-D point cloud data. A user must have some type of Geographic Information System (GIS) software to work with files. The first step is often transforming the LAS file into a different format. At Geology and Mineral Resources, we use ESRI ArcGIS products to convert the LiDAR point cloud into the raster images you see above, but there are several freeware programs that can be used to view and convert lidar data.
Where can I find lidar data?Lidar is available to the public through the U.S. Geological Survey - 3-D Elevation Program (3DEP). Existing lidar 1-meter datasets in the United States are available as either LAS, LAZ, IMG or TIFF files. You can directly download lidar data from several websites including the 3DEP LidarExplorer , the USGS direct download website and the VGIN lidar downloads website. Keep in mind that you will need GIS software to convert the data into a hillshade or slope map.
Click here to learn more about downloading and using lidar data.
Identifying Geologic Features Using Lidar
How does GMR use Lidar?
Our geologists regularly use lidar data to map the distribution of bedrock formations and surficial deposits, locate natural geologic features such as faults and sinkholes, identify areas affected by human activity such as historic mining, and assess the impact of landslides and other geologic hazards. A recent project in Petersburg National Battlefield used lidar data to identify Civil War earthworks and fort structures! Below are some examples of a variety of natural and manmade features that our geologists have identified using lidar.
Lidar Images of Common Geologic Features Throughout the Commonwealth
Identifying Landslides with Lidar
Landslides are defined as gravitational movements of earth materials (rock, soil, etc.) down a slope. They are considered a geologic hazard because they can cause considerable damage to infrastructure (roads, buildings, utilities, etc.) and pose a hazard to public safety. There are many different types of landslides. Each is categorized by the type of material that moved downslope (rock, earth, etc) and the mechanism of the movement (fall, slide, flow). All of these types of landslides, when present and of sufficient size, are clearly visable on lidar DEMs.
Debris Flows 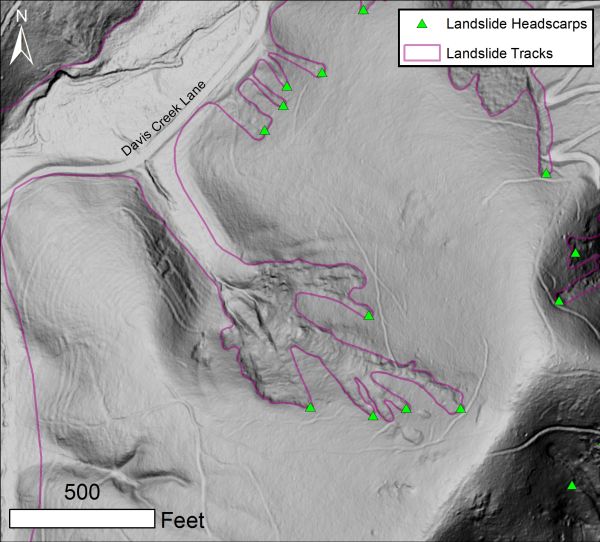
1-meter resolution lidar slopeshade of the Davis Creek area of Nelson County, Virginia
The image above shows a 1-meter resolution lidar slopeshade of the Davis Creek area of Nelson County. Numerous debris flows, were produced in the area outlined in purple during Hurricane Camille in 1969. Debris flows are a swift-moving type of landslide that can be hundreds of feet-to-miles long, narrow in width, and have a pronounced headscarp. Many thousands of debris flows occurred in Nelson, Albemarle, and Amherst Counties in 1969 due to heavy rainfall from Hurricane Camille. New lidar data is helping our geologists identify many more debris flows from Hurricane Camille than were previously known. This information helps geologists identify slope thresholds that are most prone to generating landslides and if geology plays a role in where landslides are occurring.
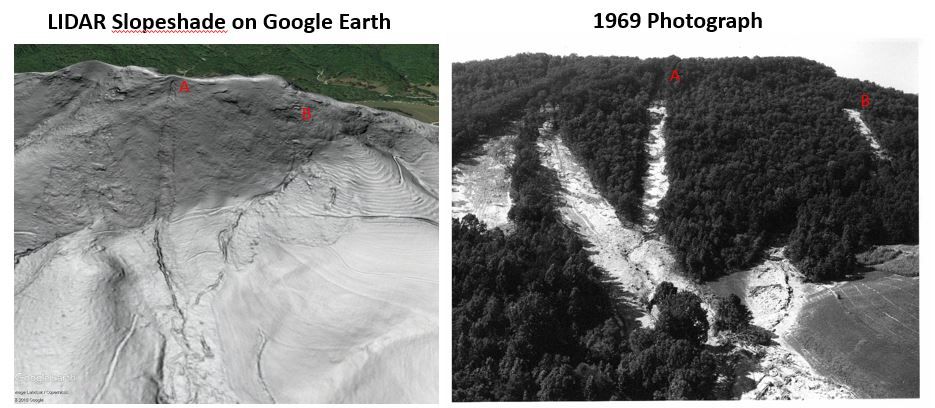
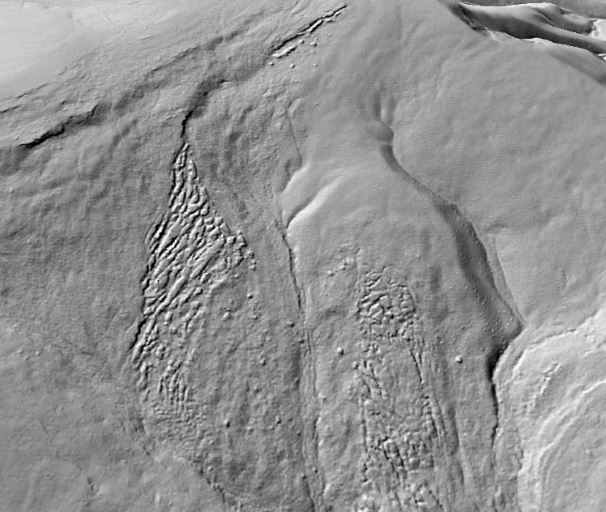
Debris flows near Myndus in Nelson County, Virginia
This image shows a series of converging debris flows near Myndus in Nelson County, generated during Hurricane Camille. Letters on the images compare the headscarp locations of debris flows on the lidar data to locations in a photograph taken by Tom Gathright in 1969.
Download a sample of lidar data for the Myndus debris flows here. You will need Google Earth loaded on your computer to view the data.
Debris and Rock SlidesLandslides can travel downslope in different ways. Sometimes they flow, like the examples above, and sometimes they slide, either as an entire block of material or disaggregating into smaller pieces. They look very different on lidar data, compared to the debris flows above.
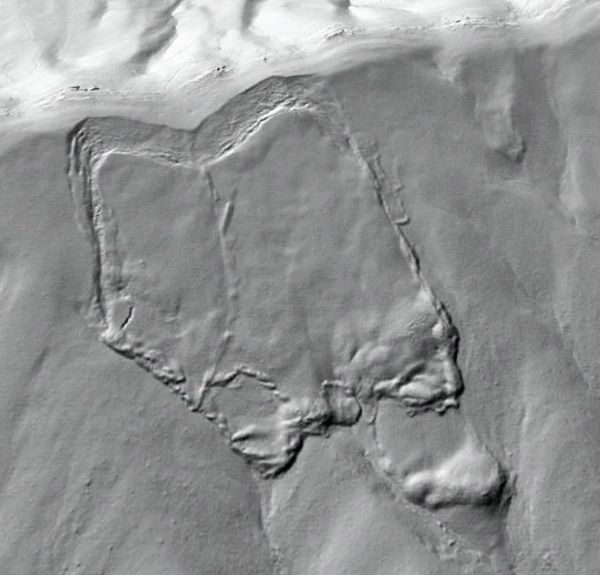
Big Walker Mountain near Long Spur, in Bland County, Virginia
Large rock slide on Big Walker Mountain near Long Spur, in Bland County. Notice how this landslide has detached from the hillside and traveled down slope as a single block of material.
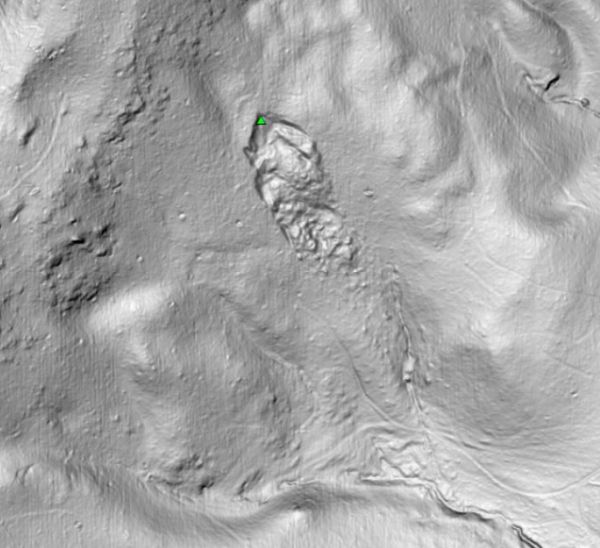
Debris slide near Schuyler in Nelson County, Virginia
This is a small debris slide near Schuyler in Nelson County. There is a prominent break in the slope at the top of the slide and the transported material has broken up into pieces. This landslide is probably associated with Hurricane Camille in 1969.
Slow-Moving Landslides
Landslides can be move very swiftly (up to 30 miles per hour) or can travel slowly and gradually, only a few inches in a year. These slower moving landslides tear hillsides apart and can cause ongoing maintenance problems for roads and property owners.
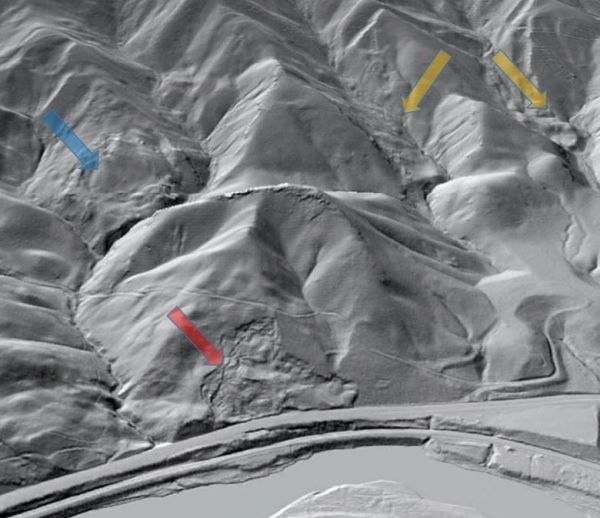
A slow-moving landslide along U.S. 460 near the town of Narrows in Giles County, Virginia
This slow-moving debris slide (red arrow) has been a problem along U.S. 460 near the town of Narrows in Giles County since the early 1900's. Excavation along the base of the slide has caused it to continuously move downslope, causing maintenance issues for the road and railroad. You can read more about this landslide here.
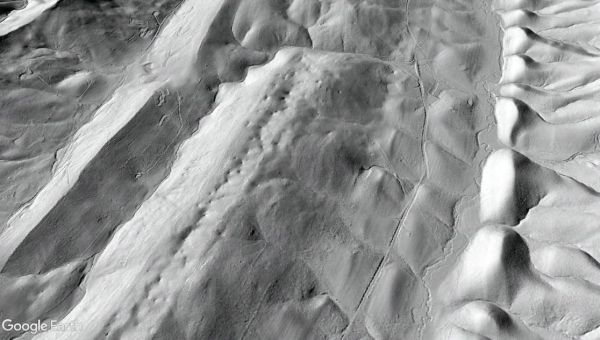
A creeping boulder field Tazewell County, Virginia
This image shows a boulder field, composed of rock from the cliff line above, which is slowly creeping down the south slope of Beartown Mountain, in Tazewell County.
Want to learn more about landslides? Learn more »
Identifying Sinkholes with LiDAR
Sinkholes are depressions in the surface of the earth that form when bedrock dissolves over geologic time, causing a void to develop. Areas underlain by soluble rock such as limestone can develop multiple sinkholes - sinkholes are one part of a landscape that geologists call "karst terrain". Most sinkholes, when present, are clearly visible on LiDAR derived data.
The image below shows numerous sinkholes in a narrow zone along a low ridge within the Catawba Valley in Roanoke County. The sinkholes are developing in limestone layers along the contact between the Beekmantown Formation and the Conococheague Formation. While a great deal of carbonate rock is present in the area shown, sinkhole development is obviously much more active within this specific set of layers.
Sinkholes in the center of this image are along the
Beekmantown-Conococheague Formation contact in Roanoke County
When carbonate rocks are exposed over a large area, sinkhole development can be widespread. The image below looks across U.S. Highway 460 in Giles County to show the "cratered" appearance of the land surface above soluable Middle Ordovician-aged limestone beds. Sinkhole development of this density can present challenges to building construction and engineering projects.
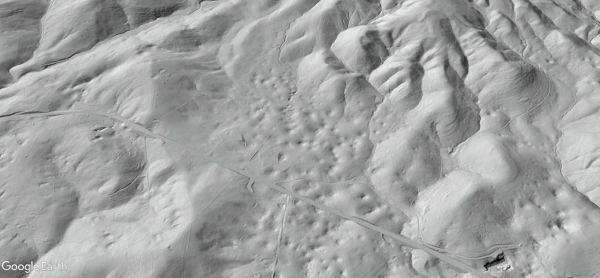
Sinkholes in Knox Group near Highway 460 Giles County
Sinkholes come in all shapes and sizes, depending on the size of the underground collapse. The large sinkhole near the top of the image below has formed in an area underlain by Middle Ordovician limestone in Bland County, and may represent the combined effects of several smaller collapse events. It is approximately 500 feet across. Note the road that curves around its lower edge.
Huge sinkhole in Bland County
Want to learn more about Sinkholes and Karst Terrain? Learn more »
Identifying Man-Made Landforms with Lidar
Any significant disturbance in the ground surface can be seen with high-resolution lidardata. A recent geologic mapping project for the Petersburg National Battlefield completed by Geology and Mineral Resources used 1-meter lidar data to identify Civil War earthworks, trenches, and fort structures that can be difficult to see with aerial photography, or even by walking the landscape on foot!
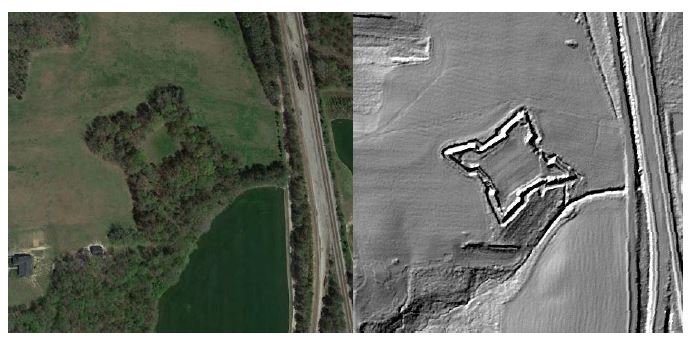
Civil War Fort
The even lines in the image below represent plowing for a tree farm in Chesterfield County. Farming and earth excavation often leave traces that clearly visable on bare-earth lidar
.jpg)
Tree farm in Chesterfield County, Virginia
This beautiful flower shape is actually five baseball fields surrounding an athletic complex in Newport News. If you look carefully, you can even pick out the pitcher's mounds!
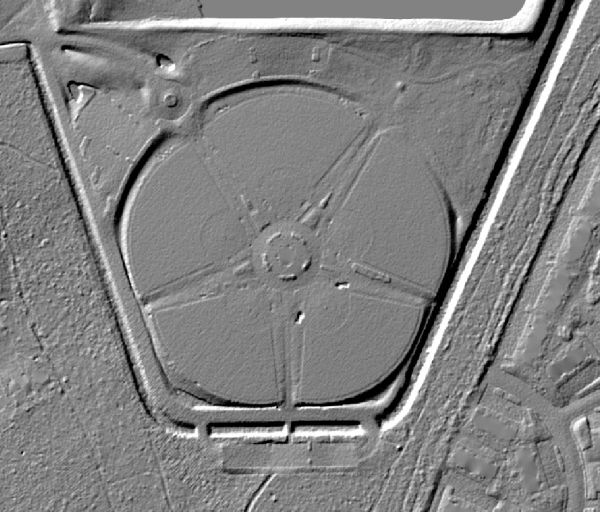
Athletic Complex Newport News, Virginia
Lidar can help us identify abandoned mine sites, as seen in the image below of the Bertha and Edith placer gold mine in Fluvanna County. Learn more about abandoned mines in Virginia.
Bertha and Edith placer gold mine, Fluvanna County, Virginia
Identifying Geologic Landforms with Lidar
A landform is defined as a naturally occurring feature of the surface of the earth. The Earth's landscape, or terrain, is composed of landforms, and their arrangement in the landscape is better known as topography. Here are some examples of landforms that geoscientists can see in 1-meter lldar derived data.
Meander Cutoffs
Rivers are constantly evolving and moving their position on the surface of the earth in order to maximize the efficiency of water transport. As a meander (or hook) in a river is abandoned, the channel fills with sediment, leaving a record of their past location. These deposits are clearly visable with 1-meter lidar derived data.
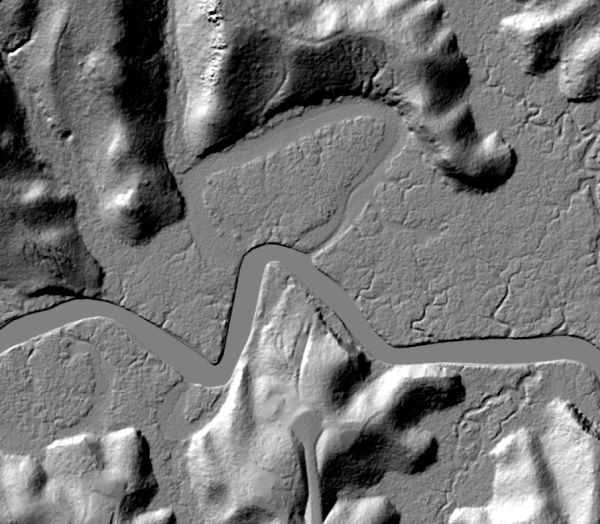
Meander cutoff
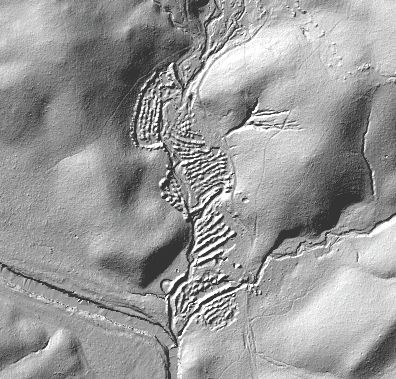
Braided StreamsThe image below shows a "braided" stream in Tazewell County. This stream has rapidly shifted its channel in recent geological history because the small but very steep streams draining the surrounding mountains supply it with more sediment that it can transport. When the actively flowing stream channel becomes choked with boulders and gravel, the stream will shift its channel slightly onto a more efficient path. This process produces the complex overlapping channels seen here.
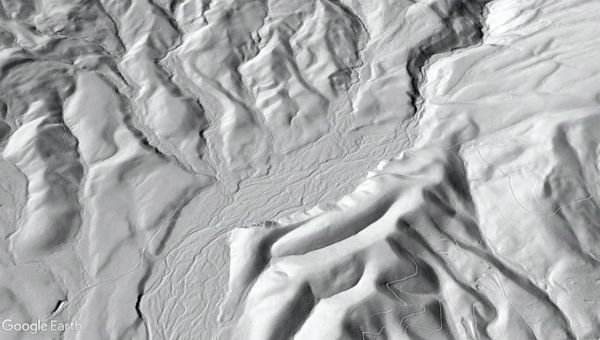
Ancient Braided stream valley Tazewell County, Virginia
FlatironsMountains in the Valley and Ridge and western Blue Ridge provinces have developed on hard sandstone or quartzite that is more resistant to erosion than adjacent rock layers such as shale, phyllite, or limestone/dolomite. The layered nature of the sandstone and quartzite sequences that support the ridges is clearly visable on lidar hillshade maps. This image shows "flatirons" on the southeast face of Peters Mountain in Giles County. When parallel streams cut through tilted sandstone layers, the neighboring V-shaped valleys divide the sandstone slope into the triangular facets seen here.
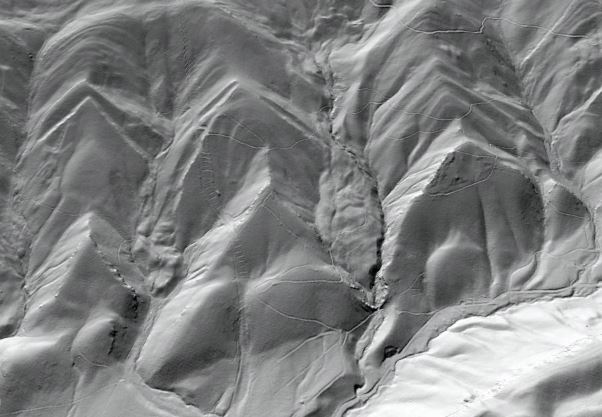
Flatirons on Peters Mountain, Giles County, Virginia
Marine TerracesThese features in the Coastal Plain geologic province are relatively flat, horizontal surfaces underlain by sediments that record a history of past sea level rise. Marine terraces often contain important natural resources like sand and gravel. Terraces like those exposed along the Pamunkey River in the image below are clearly visible with high resolution, 1-meter lidar derived hillshade maps.
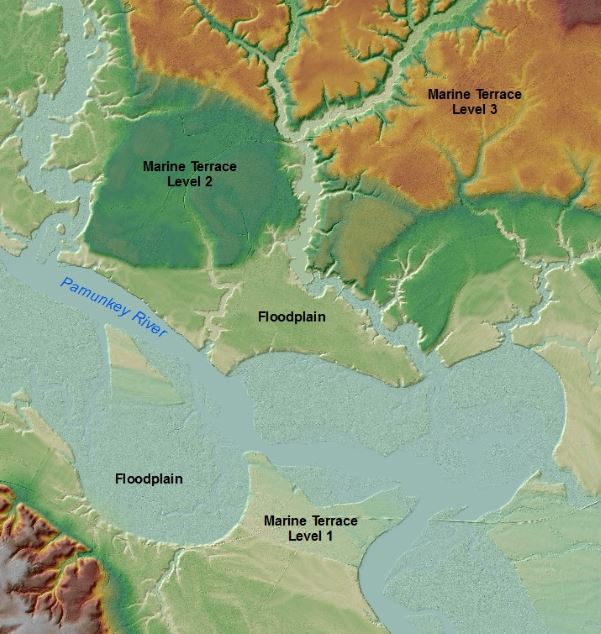
Several levels of marine terraces along the Pamunkey River near Tunstall, Virginia
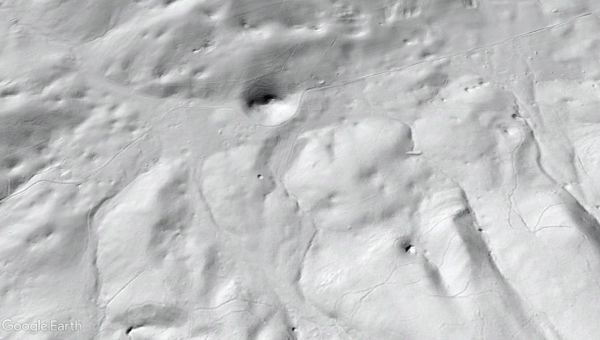
Carolina BaysThe oval depressions on the image below are not sinkholes, but are depressions known as Carolina Bays. These features are found throughout the Atlantic Coastal Plain, and are typically oriented in a northwest-southeast direction. There is several theories on the formation of the bays; they may be the result of a meteorite impact crater, melting ice after the last glaciation, or the action of sea currents. How many Carolina Bays can you identify in the image below?
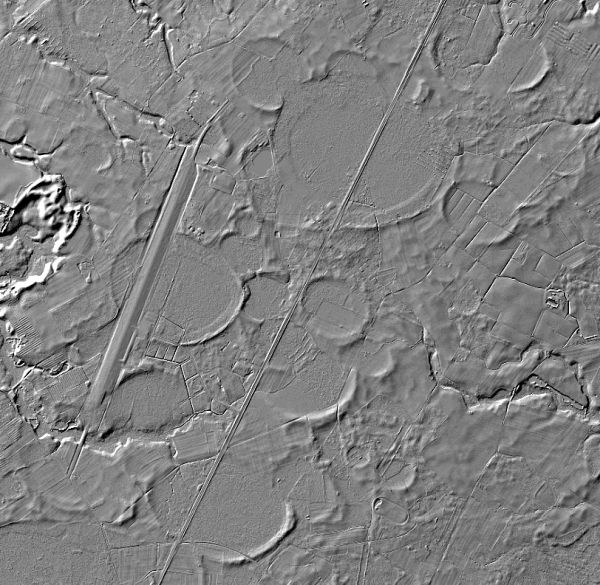
Carolina Bays in the Virginia Coastal Plain
Ancient Sand DunesThe elongate ridges that you see in this image represent old sand dunes along the Delmarva Peninsula. These relict sand dunes show how the shoreline has moved in response to sea level change over geologic time.
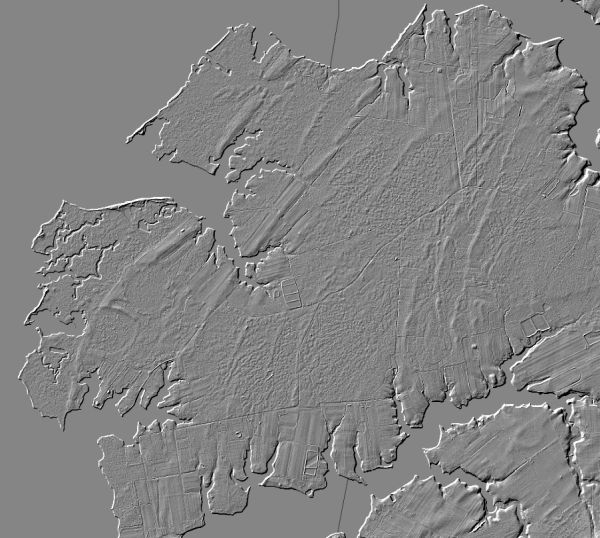
Ancient Sand Dunes